
All time high?
Child poverty could be higher now than at any time in more than two decades, but we need to get better at measuring it

This week’s Social Metrics Commission report on poverty made for grim reading. The commission found that a shocking 5.2 million children were in poverty in 2022/23 - 36 per cent of all under-18s. It is a depressing backdrop for the government to be writing its new child poverty strategy which is promised for the Spring.
The highest recorded level of child poverty
What is disturbing is not just the level of child poverty reported by the SMC but the trend. Using the commission’s ‘total resources available’ methodology, child poverty is up by 800,000 since the year prior to the pandemic (2019/20). And, according to the commission, the share of children in poverty is higher than at any time since before 2000/01. The data does not go back any further, but it is quite possible that under this measure child poverty would be at its highest level for 60 years.1
Other measures are available…
But hold on. This is not the only way of counting poverty. Many readers will know that the Social Metrics Commission’s poverty measure is a civil society initiative. The methodology is widely-respected but it is still unofficial and pretty new (the DWP has recently started work on turning it into an official statistic).
And this week’s findings are a bit of a surprise because other measures of poverty have been painting a slightly less bleak picture. There is the DWP’s standard measure of poverty which the government has said will guide the forthcoming child poverty strategy. This official ‘after housing costs’ measure reports that child poverty is higher than during the pandemic years but has not quite returned to levels seen in the late 2010s and 2000s (see chart)2.
CHART: Child poverty is at an all time high under the new ‘total resources available’ approach but not when using two other well-established methodologies
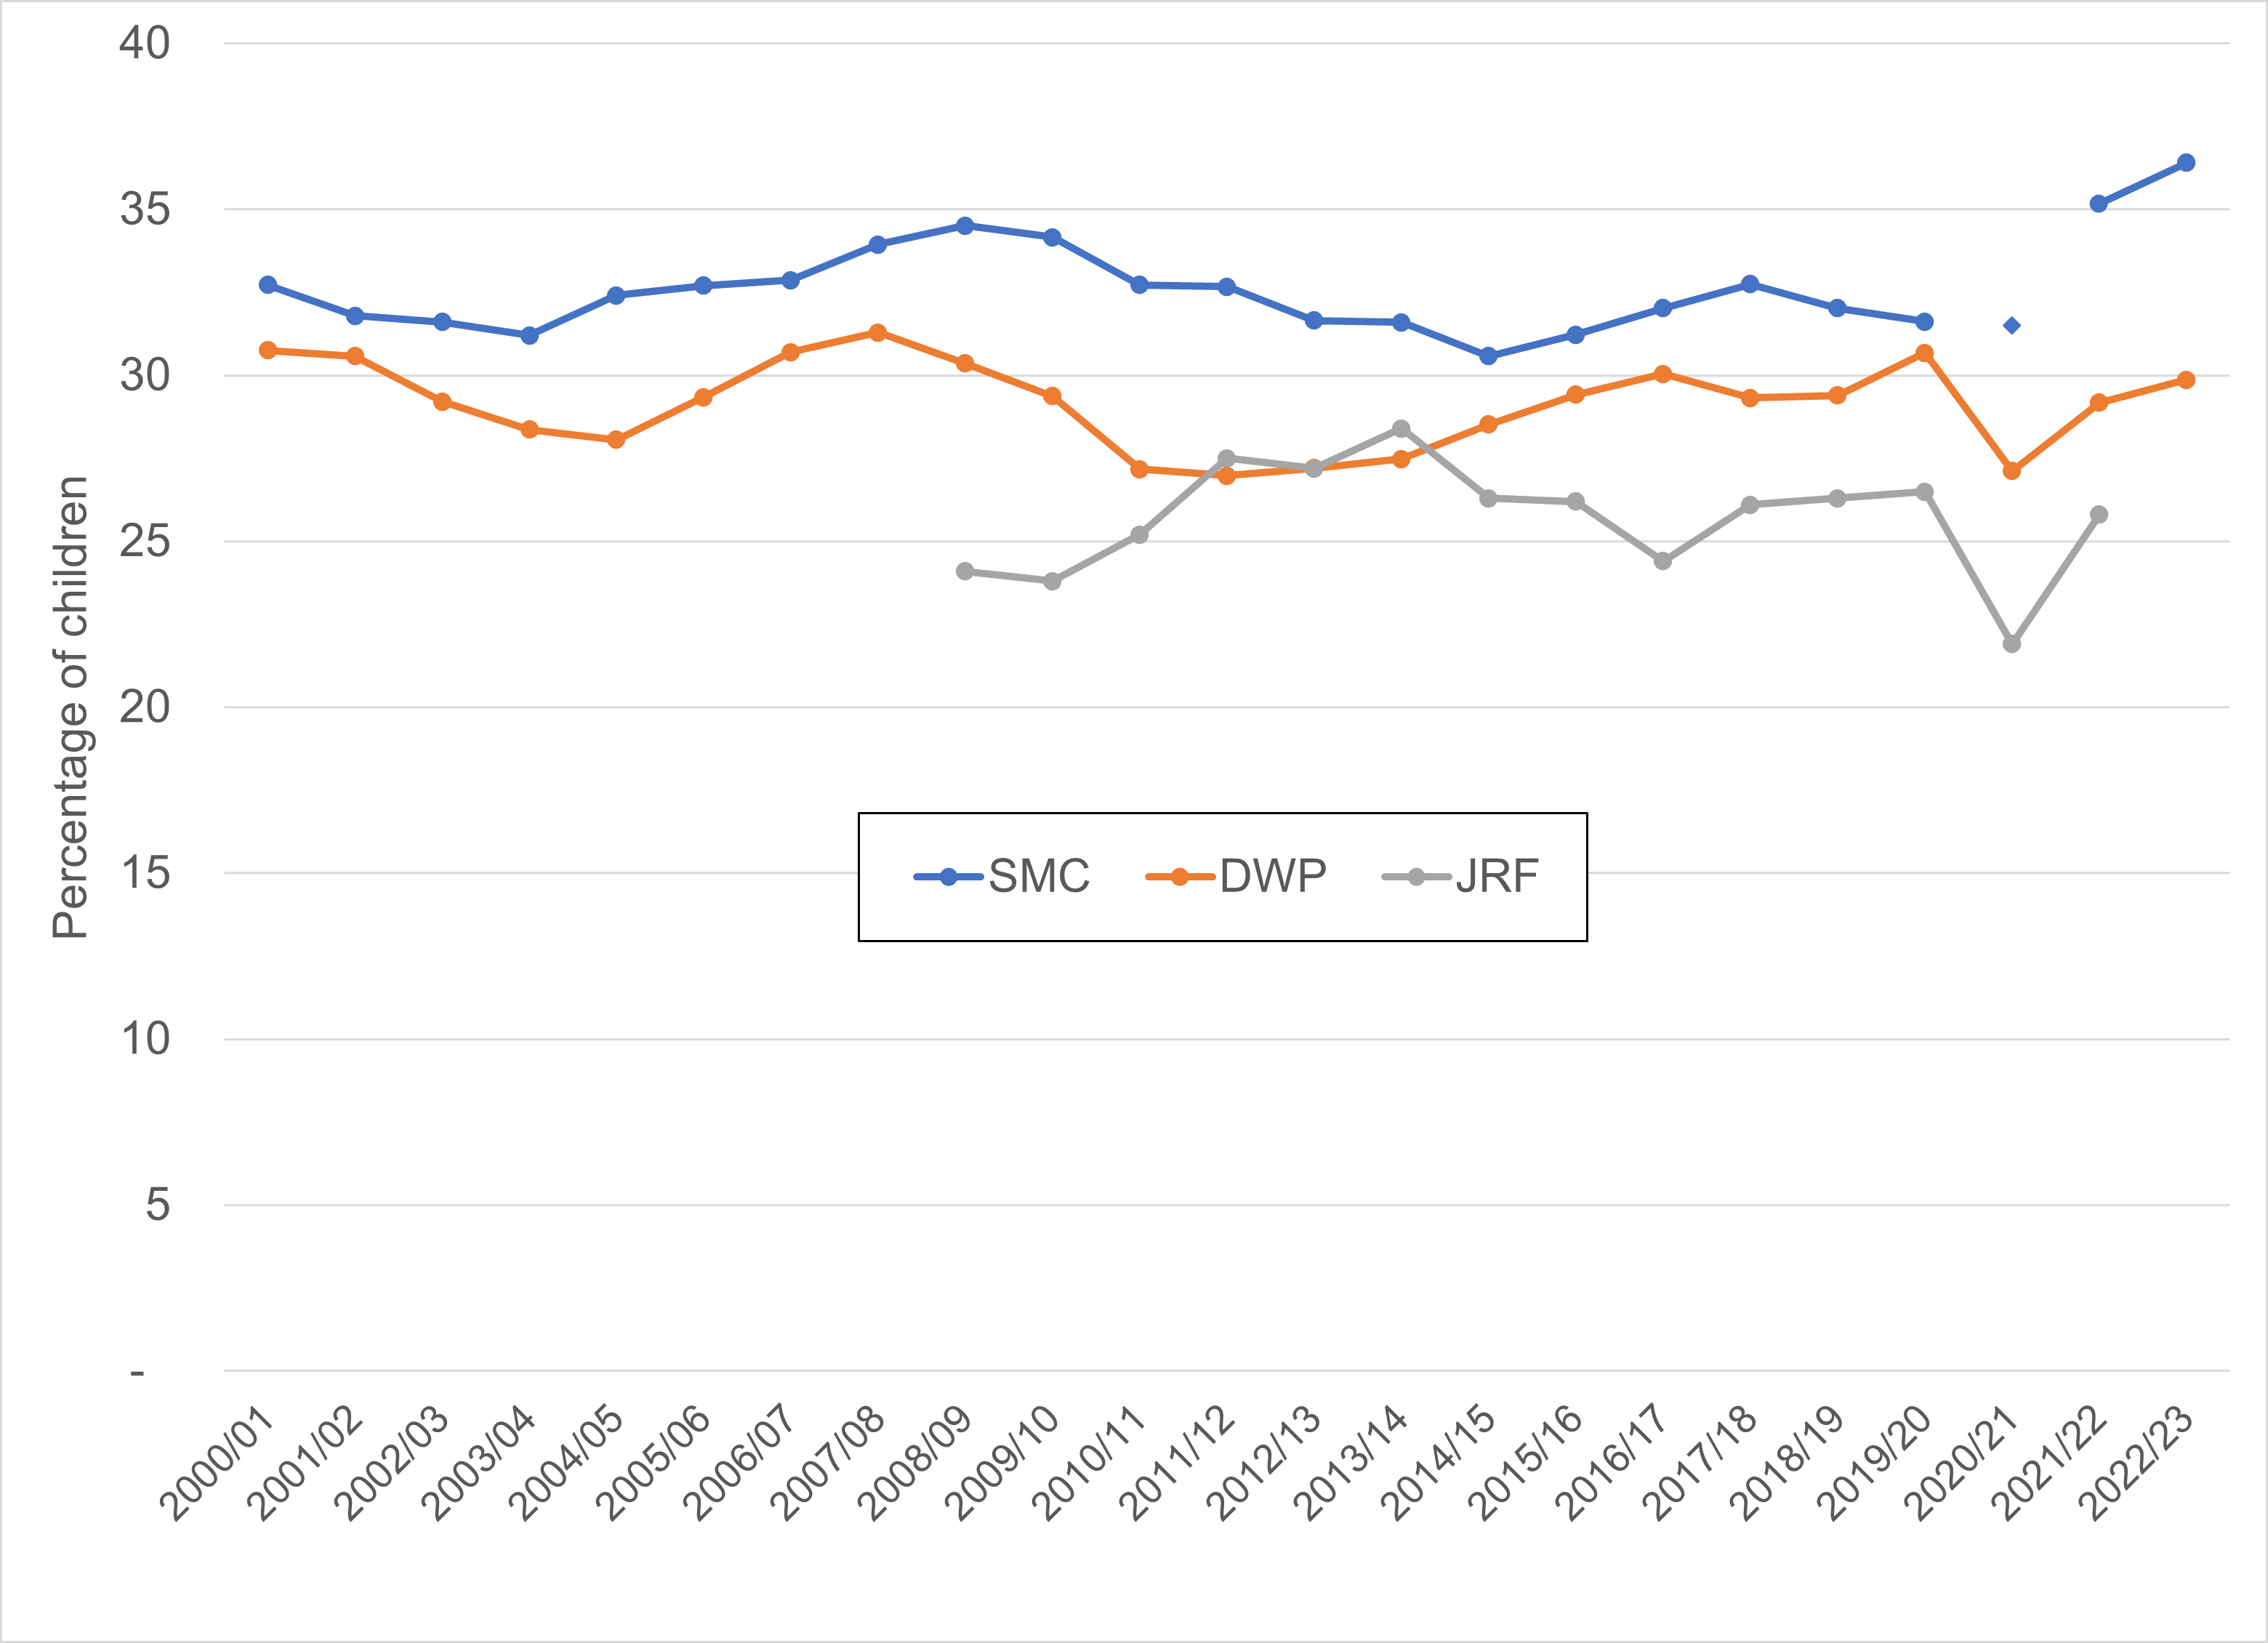
Or you can look at the measure developed by the Joseph Rowntree Foundation and University of Loughborough, which reports how many children live in families with incomes below 75 per cent of the Minimum Income Standard. In 2021/22 child poverty on this measure was broadly in line with rates seen in the 2010s.
It is notable that all three of these poverty statistics use the same underlying dataset, the Family Resources Survey. So the divergence in trends is not down to survey design or random variations in data samples. So what is going on - and is child poverty at a record high or not?
Pick a measure… or watch all three
The chart shows that in the five years before the pandemic the three methodologies produced child poverty statistics that all moved together – or rather did not move, as the trend was flat.
Since the pandemic this is no longer the case. Child poverty on the SMC measure has increased a lot compared to the late-2010s, while poverty using the other two approaches is only back to where it was pre-pandemic. The reason for this divergence is not really clear. My guess is that the rising cost of childcare is a factor but it would be great to see some DWP analysis that picks this apart.
These are all good measures. There is not a ‘right’ or ‘wrong’ answer about which to use as they each set out to track slightly different things (this footnote explains how they vary).3 But personally I would be reluctant to say that child poverty is at a new peak until all three measures have matched or exceeded their previous highs.
Others will prefer to go with the SMC measure, and not just because it currently produces the best (or worst!) headlines. The SMC approach is probably strongest at capturing real world experiences of hardship. That is certainly the conclusion you draw from the DWP’s experimental analysis published earlier this year, which found that people are more likely to experience food insecurity and material deprivation if they are in poverty under the SMC measure than the standard DWP methodology. If one measure of child poverty is going to reach a record high, you definitely don’t want it to be this one.
For now we should continue to track all three metrics and see what happens next. It would be great for the child poverty strategy to commit to publishing data and measuring performance for them all.
Child poverty may be higher still by now
Poverty statistics look through a rear-view mirror. The numbers reported by the SMC this week were for the 2022/23 financial year which ended 18 months ago (and we won’t get this data for the JRF measure until 2025). Even the official DWP statistics are published 12 months after the end of the financial year they measure.
In the mean time child poverty is likely to have increased, as a result of changes in prices, rents, benefits and the labour market. Using the official DWP measure, Resolution Foundation projections suggest these factors have together driven a modest rise in child poverty over the last two years. For example, as each year goes by, more large families get caught by the two child limit.
The long lag on data is a serious issue now that we have a government committed to reducing child poverty. As things stand, ministers will not be able to say how much poverty there was on the day of the 2024 election until March 2026. And going into the next election they will probably only have data for 2026/27 or 2027/28.
Ministers who want to show progress when the country next votes really need to find ways to accelerate the production of these statistics (without sacrificing quality). They should also ask the OBR to work with the DWP to develop robust independent ‘nowcasts’ of poverty based on the latest economic data.
We may even be under-counting child poverty
But that is not the end of the story. Even though the SMC reports child poverty to be at a record high, it may be undercounting poverty. This is because the commission applies long-established DWP assumptions about how much it costs to secure the same living standards for families with and without children.
These ‘equivalisation’ scales, which are used by both DWP and the Social Metrics Commission, have no up-to-date empirical underpinning. They are just based on longstanding statistical convention. We can do better than that, as these days we have actual data on how much it costs households of different sizes to meet similar minimum needs.
These Minimum Income Standard figures suggest that the cost of each child is closer to that of an adult than our conventions assume. This finding needs stress-testing and validating. But if it is true, we need to adjust all our poverty statistics, both now and looking backwards. It is likely that poverty is higher than we think among families with children, and lower for households without anyone under 18.
But we are also flying blind
All our poverty statistics rely on the Family Resources Survey. But it turns out that the survey is not providing us with very accurate data. It has long been known that the FRS underreports the amount of money that people receive in benefits. This means that it is likely to be understating how much money low-income households have, and potentially overstating levels of poverty.
The DWP has been working to resolve this issue by linking survey data to administrative records. In the course of this work it has confirmed that many people were not reporting all the benefits they receive (which could imply that poverty is being overcounted). But the department has also discovered that the FRS has been speaking to fewer people receiving benefits than had been assumed (which could imply poverty is being undercounted).
Experimental data that corrects for these problems should hopefully be available next year. But until it is, we won’t really know where we stand. There could be major revisions to the child poverty statistics in 2025 or 2026, just as ministers are trying to bed-in the new child poverty strategy.
At this stage we don’t know if the poverty numbers will rise or fall. But, either way, what will really count is the trend line over time. Methodological questions matter. But, for each and every measure, the priority must be to watch whether the numbers of children in poverty are going up or down.
Using the standard poverty measure, child poverty soared in the 1980s, peaked in the 1990s and had declined slightly by 2000/01
Sources: Social Metrics Commission, DWP, JRF. The SMC data point for 2020/21 is from DWP analysis published earlier this year not the latest SMC report
The three poverty measures all track inadequate living standards by looking at families’ disposable financial resources adjusted to reflect their costs and needs. But they each do this in different ways:
The main DWP poverty indicator tracks living standards using a measure of disposable income that deducts housing costs and makes an adjustment to reflect the size of family. The poverty line is set at 60 per cent of contemporary median household income, so that it records the number of people with incomes well below what is typical in any given year.
The JRF measure uses a similar measure of disposable income but also deducts the costs of childcare. Its poverty line is set at 75 per cent of the Minimum Income Standard, the amount of money needed to buy the goods and services required to secure a reasonable minimum living standard. This approach therefore counts people in households with disposable incomes considerably below what they need to meet their needs, and takes account of the price of essentials and changing social norms. For a decade or so this poverty line was lower than the main DWP one. But in 2022/23 the position was reversed thanks to the cost-of-living crisis.
The SMC indicator measures poverty with respect to ‘total resources available’. This is different from the standard DWP measure of ‘after housing costs’ income in three main ways:
An assumed contribution from a households liquid assets is added (making this a measure of financial resources not just income)
Childcare costs are subtracted
Income from disability benefits is subtracted (on the grounds that this money is designed to meet unavoidable costs caused by disability).
These differences in approach explain why this metric has diverged from the main DWP measure. When first introduced the idea was that the overall number of people in poverty should be the same as under the DWP measure (to achieve this the SMC poverty line was set at 54 per cent of a median family’s ‘total resources available’). Since then poverty has increased by more using the SMC approach than the official measure. For families with children, the most likely reason for the divergence between the SMC and DWP measure is rising childcare costs (it is hard to come up with a clear explanatory story on the basis of the other methodological differences - ie the treatment of assets and disability benefits).